
Demystifying Debuggers, Part 6: Recording & Displaying Debuggee State
Introducing the basics of recording debuggee state and displaying it to the user.

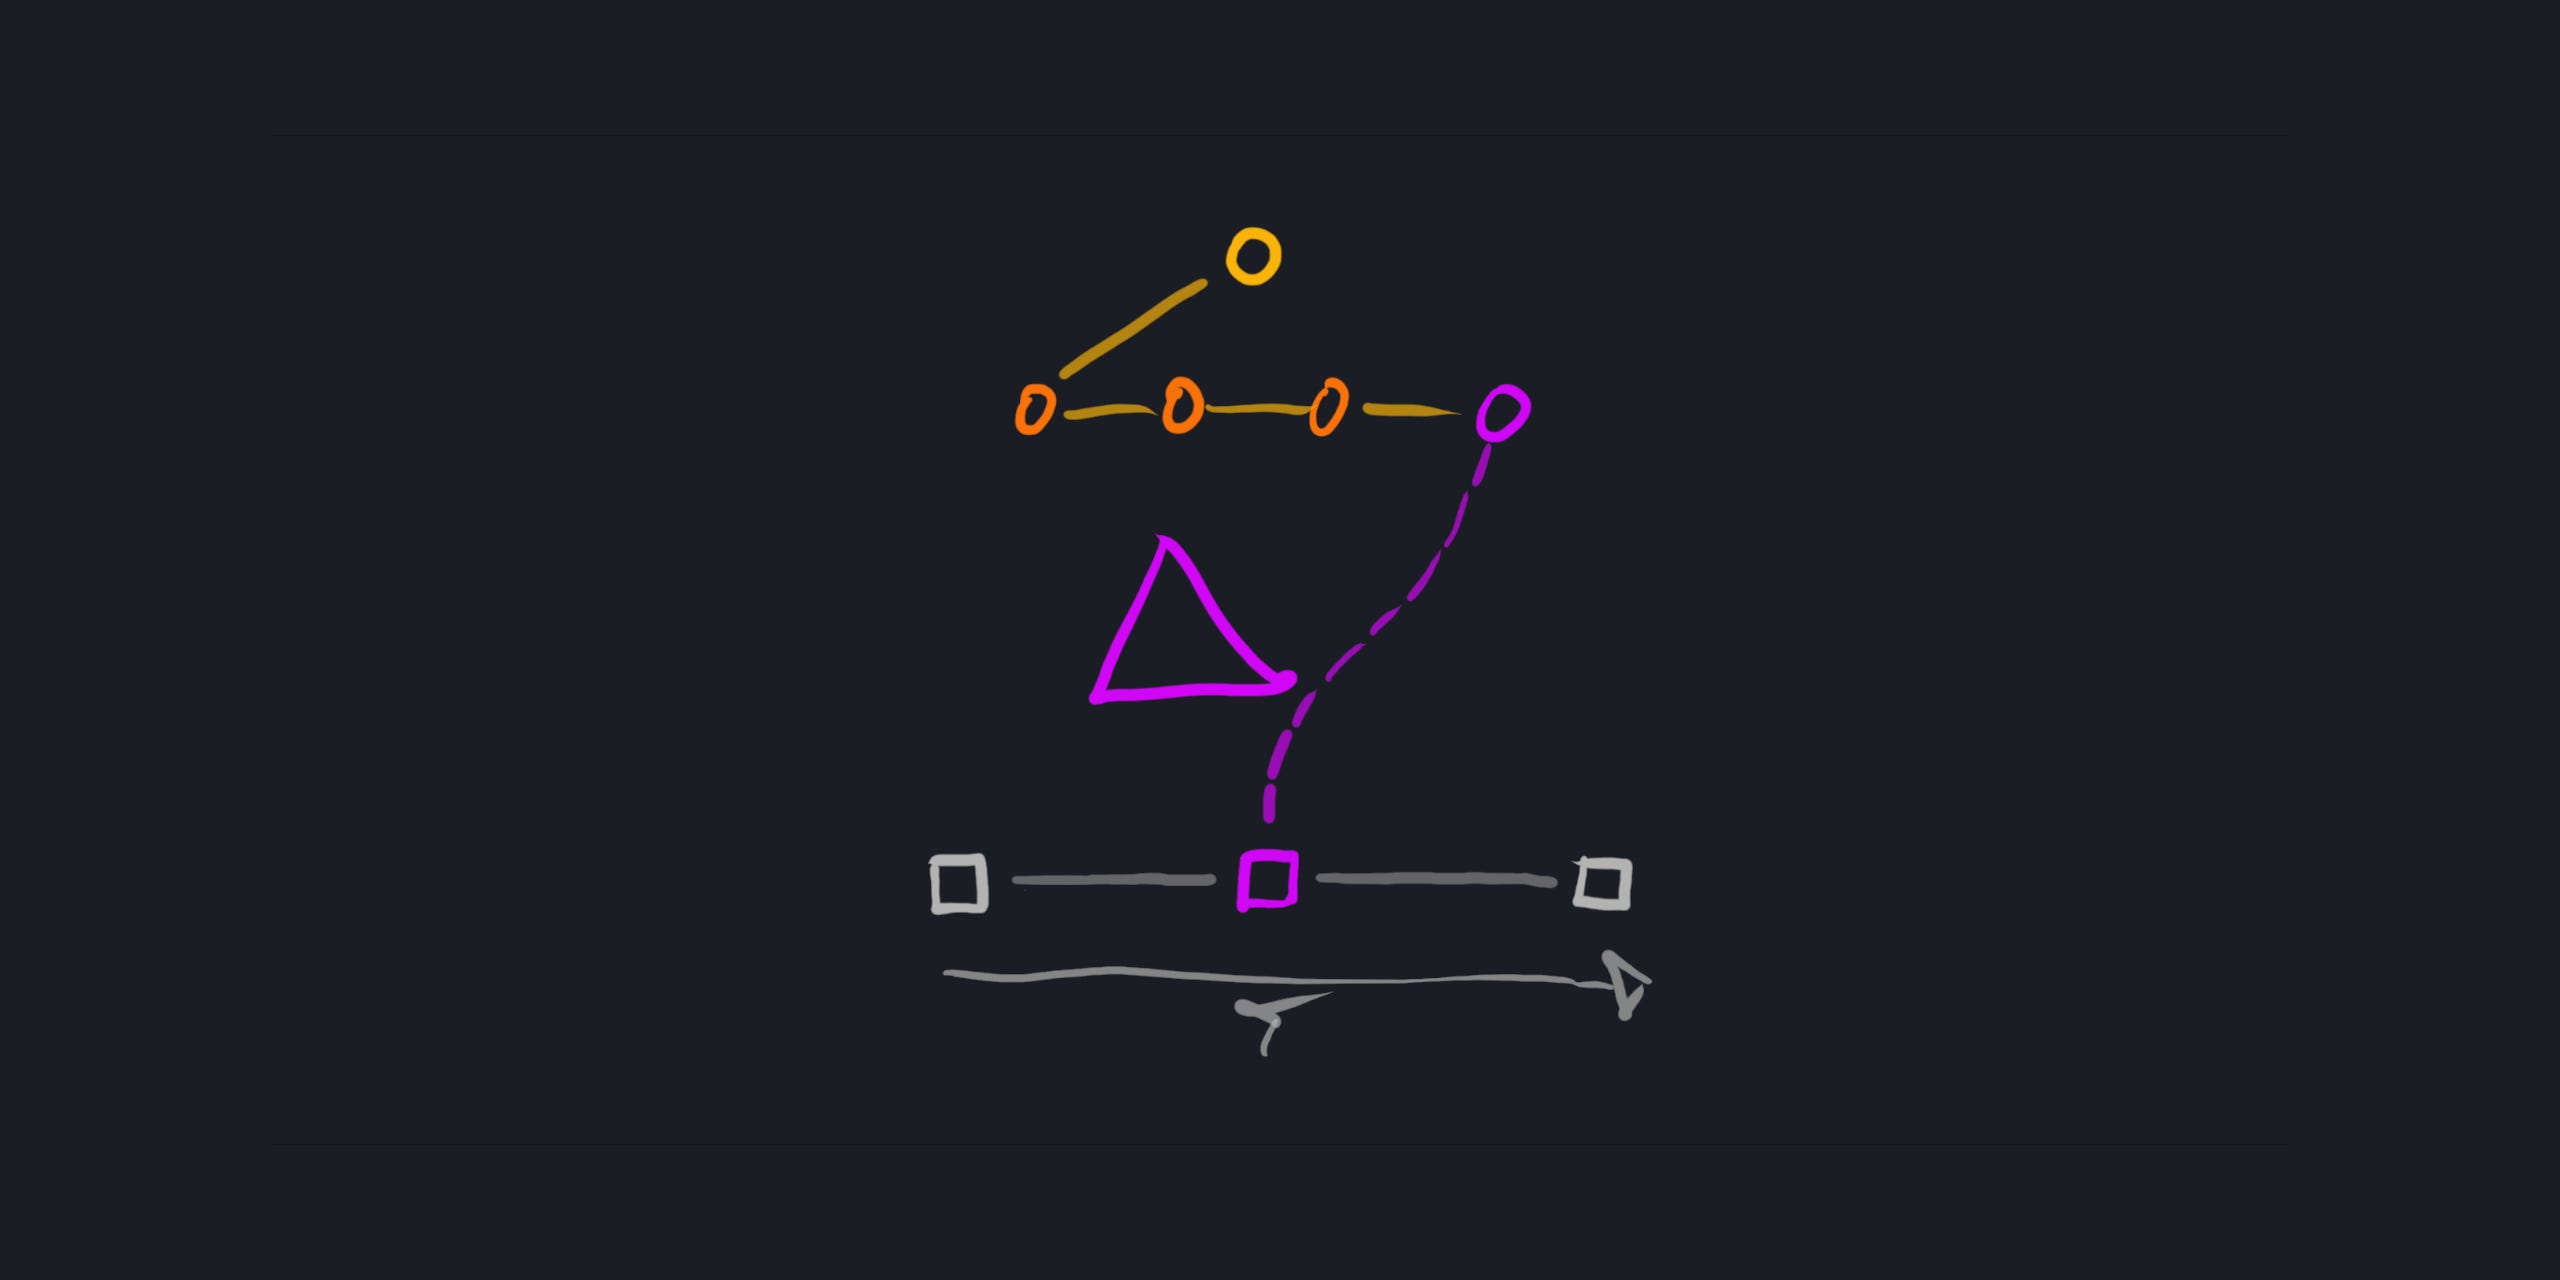
Our simple control loop from Part 5 can be controlled with a few commands. These commands can have a textual representation, exposed—for example—through a rudimentary command-line interface (or similar):
bp X, to set an address breakpoint at addressXstep Y, to perform an instruction-level step on threadYresume, to resume debuggee executionquit, to terminate the process and end the loop
If we imagine writing these commands, we’ll quickly realize that to set a breakpoint at address X, or to step thread Y, we need to know which addresses are relevant, and which threads are available. The debugger needs to communicate that to us somehow.
We also need to be able to interpret a user’s reference to a thread or address correctly. Our implementation for the step command was:
case CommandKind_Step:
{
  U32 thread_id = ...; // obtain thread ID from command parameters
  ThreadHandle thread_handle = ThreadHandleFromID(thread_id);
  SetThreadSingleStepBit(thread_handle);
  need_commands = 0;
}break;
Given this implementation, we know that our debugger must support the mapping ID → ThreadHandle, if the user supplies the thread’s ID, as the above snippet suggests. If we display a list to the user of all threads and their IDs, that will at least offer them this functionality.
That said, requiring that users refer to threads by ID only is an unfortunate restriction. Perhaps we’d also like users to be able to refer to them by name. Thus, our debugger must also support mapping Name → ThreadHandle.
Furthermore, our implementation for the bp command was: