
Demystifying Debuggers, Part 4: CPU Features & Debuggers
On CPU features that debuggers can use, like interruption instructions, debug registers, single-stepping mode, and more.

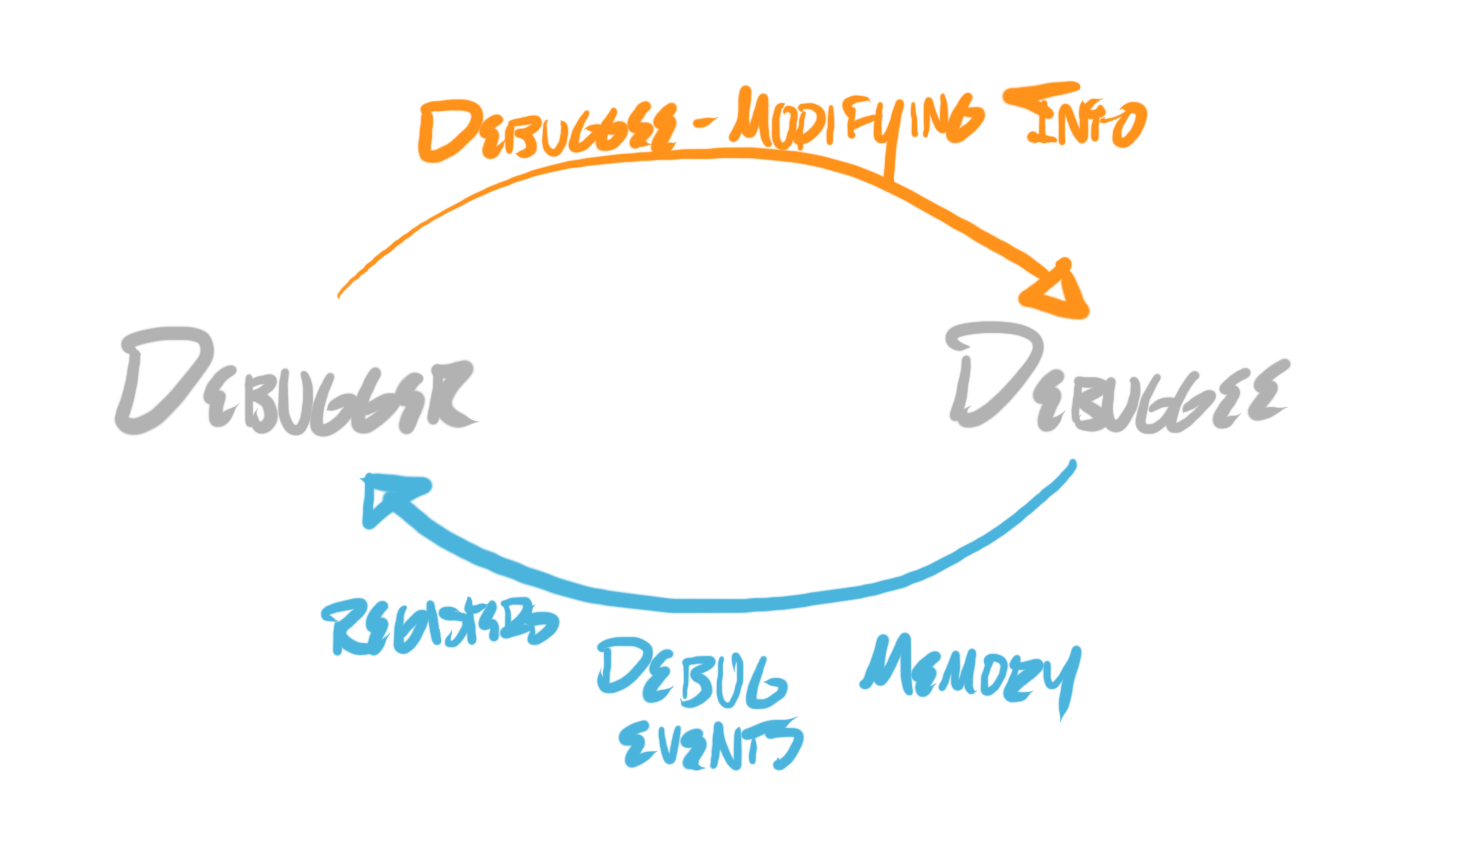
I covered in Part 3 that debuggers help analyze programs—“debuggees”—both by reading from, and writing to, them. The kernel exposes features which facilitate this bi-directional flow of information. A debugger can receive debug events, read memory, read registers, and write memory, and write registers.
But what, exactly, does a debugger write into a debuggee’s registers or memory to modify it?
CPUs have a number of mechanisms—exposed by their instruction set architecture definitions—that are built for debugging. By modifying registers or memory, a debugger can make use of these mechanisms.
A debugger can use specific registers to set up the CPU such that it behaves differently when executing debuggee code. A debugger can also dynamically modify instruction memory, to dynamically adjust which instructions are executed by debuggee threads, at certain points in codepaths.
In this post, I’ll cover the basics of the following CPU mechanisms, and how they can be used by a debugger:
Instruction pointer register — A register which is used to store at which address the CPU will next execute an instruction.
Interruption instructions — Instructions that can be written into an instruction stream, which cause the CPU core to interrupt execution of that instruction stream.
Data breakpoint registers — Registers which are used to implement “data breakpoints”, where an exception will occur if some number of bytes at specific addresses are written to, read from, or executed.
Single-stepping mode — A mode which causes the CPU core to immediately interrupt after executing a single instruction.
Return instructions — Instructions which return from a called procedure, replacing the instruction pointer with one stored on a thread’s call stack.